International DevOps Certification Academy™
How Do You Create Monitoring (Telemetry) To Manage Your DevOps Software Life Cycle?
From your experience in IT industry you can already easily tell that when things go wrong it is not trivial to identify root causes of issues. The problem can be in your software applications, in your environments or in other components your applications and environments are integrated to.
When you look at the development of relatively complex client and server platforms during last 50 years, one type of event which has been frequently occurring is that: When a server starts behaving suboptimally, throwing errors and it doesn’t deliver, you simply restart it by hoping that restart will resolve issues. Indeed a restart can sometimes temporarily undo a problem that you have never understood. And yet, if this doesn’t help, your next stop is developers and testers who didn’t properly deliver and who didn’t properly identify issues while the software was tested. All this chaos will not only impact client satisfaction from your services, but it will also pollute working climate in your organization.
Champion DevOps organizations do barely restart their servers during rectification of their issues. They deploy systematic approaches to identify and resolve problems. They rely on production telemetry to understand root causes and contributing factors to problems instead of blindly restarting servers. They have 96 times better MTTR (Mean time to recover) than other organizations. In other words they solve their production issues 96 times faster than an average company. Top technical practice of champion DevOps organizations is they deploy telemetry in their software and in their applications.
What is Telemetry?
In pretty simple terms telemetry is the process of recording the behaviour of your systems.
To make this happen you need to design your software, your production and pre-production environments and your deployment pipeline in a way that they continuously generate records for telemetry. Your goal is to deploy enough telemetry, so that you can confirm that your services do correctly function in your production environments. When a problem occurs, thanks to viewing your telemetry records, you can quickly understand what the problem is and take informed decisions to rectify it.
Furthermore, telemetry helps you validate your understanding of what is happening in your production systems compared to what is happening in your production systems in reality, so you can easily see if they correlate.
Build Your Telemetry Infrastructure
In order to have telemetry you need to have two major components in place:
- Recording of Telemetry Metrics: All High Performer DevOps organizations constantly record hundreds of thousands of metrics at every layer of their applications, environments and deployment pipeline. A few examples are events in business logic such as number of sales or server platform health checks such as monitoring of operating systems, databases, disk I/O operations, network I/O operations, RAM, CPU and Security.
- A Central Platform to Manage Telemetry Metrics: This platform stores metrics and events. It enables visualization, trending, sampling, alerting, anomaly detection. It converts logs into metrics such as number of fatal exceptions in a software application. Furthermore, events in your deployment pipeline such as commits, rollbacks, installations, uninstallations, automated test results in production and pre-production environments should be also stored in the same telemetry infrastructure.
You, your DevOps team and all other stakeholders working together with your DevOps team should be able to retrieve information from your telemetry Platform via self-service APIs and GUIs, instead of opening tickets to send requests to access telemetry information.
All of your telemetry information must be 100% accessible to your entire organization except telemetry metrics which may violate privacy and jeopardize security of your clients.
Types of Telemetry Metrics
- Business Layer Metrics: Such as A/B testing results, profit, revenue, number of new users, average session durations, number of completed orders and number of abandoned checkouts.
- Application Layer Metrics: Such as application response times, transaction durations, number of core dumps and number of fatal exceptions.
- Infrastructure Layer Metrics: Such as server traffic, disk I/O operations, network I/O operations, RAM, CPU and disk usage.
- Client Layer Metrics: Such as client application response times and client errors on web, mobile, JavaScript and other client applications.
- Deployment Pipeline Layer Metrics: Such as check-ins, deployment lead times, frequencies, status of environments and green/amber/red status results after execution of automated tests.
It is profoundly important to build your metrics within hierarchies under various categories and nested sub-categories, so you and your DevOps team can easily interpret them.
Make it easy to understand log entries of your applications which will be later converted into telemetry metrics. Just like you group logs under various event categories, do a similar a grouping for your telemetry metrics too. An example of such a grouping is: Debug, Info, Warn, Error and Fatal levels of telemetry metrics.
Use Your Telemetry Information To Guide Problem Solving
If your organization has a culture of blame, nobody wants to make changes in production systems fully visible and nobody is willing to display telemetry. In this atmosphere, root causes of issues are barely correctly identified and worst of all no new organizational learnings happen.
In order to ensure you can use your telemetry to guide problem solving, make sure creation of telemetry becomes a daily job for your entire DevOps team. Create easy to use libraries, so that one line fo code easily creates a telemetry record.
Furthermore, create telemetry records for write events of your version controlling system and running environments, so from your telemetry monitoring, it will be very clear and easy to visualize the correlation between changes you do in your systems and their associated impact on your clients.
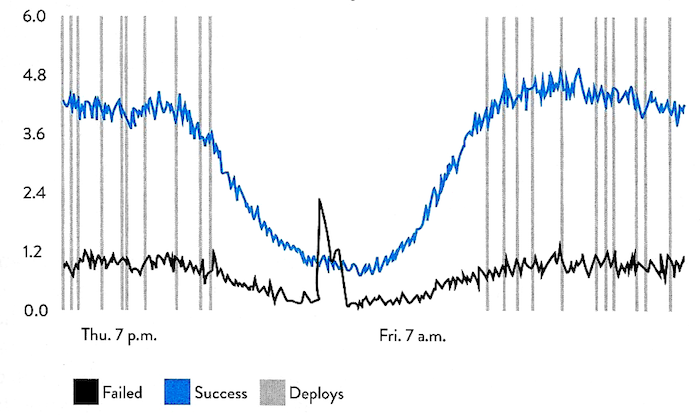
As an example: From the below chart it is very clear to see that one of the last deployments on Thursday evening is a probable root cause which increased the failed purchase events from your checkout flow.
�

Deployments vs Key Business Events Chart
Increased Failure and Reduced Success Rates of Purchase Events between Two Deployments
(Source: Measure Anything, Measure Everything, DevOps Handbook)
Telemetry will help you communicate about issues in detail. You and your DevOps teams have nothing to hide from yourselves and from your stakeholders. Therefore, you constantly monitor and present charts like above to your stakeholders in realtime to support quick identification of issues and to see potential cause & effect relationships between your deployments and key business events. Business people become a better understanding and transparency about the work you and your team perform. Furthermore, DevOps Developers and DevOps Operations Engineers see the correlation between incidents and deployments.
Telemetry enables you to see the problems while are easy and cheap to fix, so you undo them before they spread and you build other problems onto them.
With telemetry you and your DevOps team can identify patterns of key business and technology metrics and create alerts if anomalies happen. Your alert thresholds in the beginning can be false and they may generate false positives. This is totally normal. Don’t panic. And don’t let anyone undermine your effort and investment to build your telemetry infrastructure. Like everything else in your complex systems, you will figure this out too and fine-tune acceptable thresholds for your alerts too, so they will work for you, your clients and business.
CONCLUSION
Champion DevOps organizations identify impact of problems as measurable business metrics such as number of lost clients or lost revenue. So everyone in their DevOps organizations become more sensible about telemetry. Not only in production, but also in pre-production environments. They invest time and resources to build and use telemetry, and they rely on using telemetry to quickly identify and undo their errors.
 DEVOPS-CERTIFICATION.ORG


